Top 10 Tips to Make Your Salesforce Reports More Powerful
Salesforce Reports are the backbone of decision-making in any organization. Whether you’re tracking sales performance, monitoring customer service KPIs, or analyzing marketing campaigns, powerful reports can turn raw data into actionable insights.
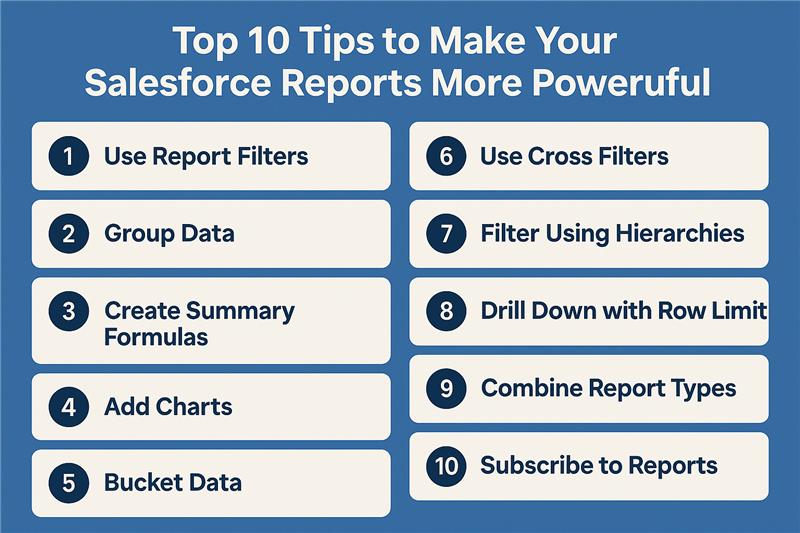
But are you getting the most out of your Salesforce reports? Here are 10 practical tips to help you take your reporting game to the next level.
1. Use the Right Report Type from the Start
Your report is only as good as the report type you choose. Standard report types work for most needs, but Custom Report Types give you control over which objects and relationships are included. This ensures you don’t miss critical data.
2. Leverage Summary and Matrix Reports
Tabular reports are great for raw data dumps, but they don’t give much insight.
- Summary reports allow grouping and subtotals.
- Matrix reports let you compare values in rows and columns, ideal for performance comparisons across teams, regions, or products.
3. Master Filters and Cross Filters
Filters are the foundation of accurate reporting.
- Use standard filters to narrow down data.
- Apply cross filters to include or exclude related records (e.g., “Accounts with Opportunities” or “Contacts without Cases”).
This helps eliminate noise and focus only on what matters.
4. Use Bucket Fields to Simplify Data
Don’t create unnecessary custom fields just for categorization. Bucket fields allow you to group values into ranges or categories directly in the report. Example: Categorize deal sizes as Small, Medium, Large based on Amount.
5. Add Row-Level and Summary Formulas
Formulas turn static reports into dynamic analysis tools.
- Row-Level Formulas: Create calculations at the record level (e.g., “Total Value = Hours × Rate”).
- Summary Formulas: Perform calculations on groups of data (e.g., “Average Revenue per Account”).
6. Use Conditional Highlighting
Make reports visually impactful with conditional formatting. Highlight KPIs like revenue, pipeline size, or case resolution time in red/yellow/green to instantly identify problem areas or successes.
7. Apply Role-Based and Dynamic Filters
Instead of creating multiple copies of the same report for different users, use:
- Dynamic filters like “My Team’s Accounts” or “My Opportunities.”
- Role-based filters to respect hierarchy.
This saves time and ensures scalability.
8. Combine Data with Joined Reports
If you need insights from multiple objects, use Joined Reports. Example: Compare pipeline Opportunities with open Support Cases for the same Accounts. This gives a 360° view without jumping across multiple reports.
9. Schedule and Subscribe to Reports
Don’t waste time manually pulling reports.
- Schedule reports to be emailed daily, weekly, or monthly.
- Subscribe to reports so you and your team are alerted when metrics cross thresholds (e.g., pipeline drops below target).
10. Tie Reports to Dashboards
Reports are powerful, but Dashboards bring them to life. Add your reports as components to dashboards for a visual, interactive experience. Use charts, tables, and gauges to help stakeholders quickly digest key insights.
✅ Final Thoughts
Salesforce reports are more than just data dumps — they’re decision-making engines. By applying these 10 tips, you’ll not only improve report accuracy but also deliver insights that drive business growth.
Start small: apply a filter, add a formula, or test a matrix report. Over time, you’ll build a reporting strategy that empowers every department in your organization.